The SPE folders (SPE0 … SPE7) each have ten sub-items.
- SPUTrack
- SPUCore
- SPEChannel
- LS_Stats
- SPUMemory
- MFC
- MFC_XLate
- SPUStats
- Model
- Load-Exec
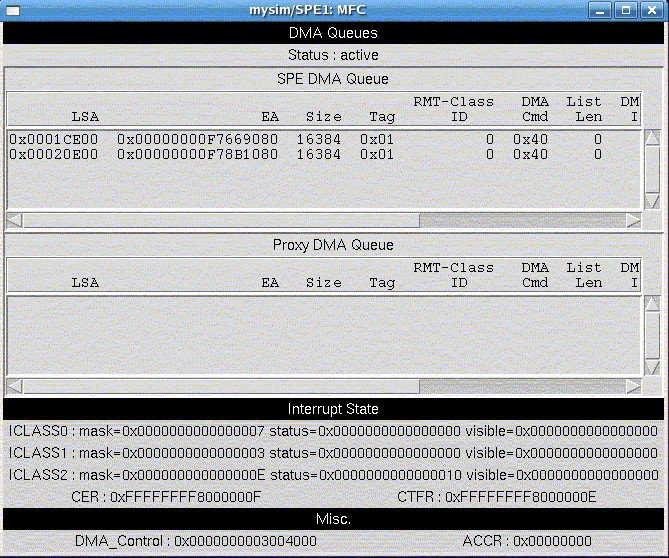
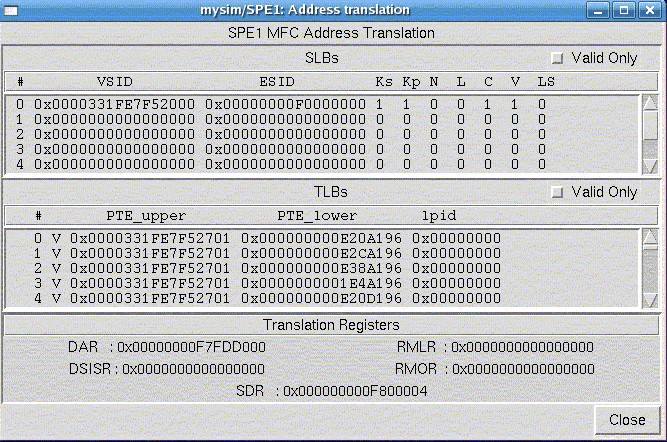
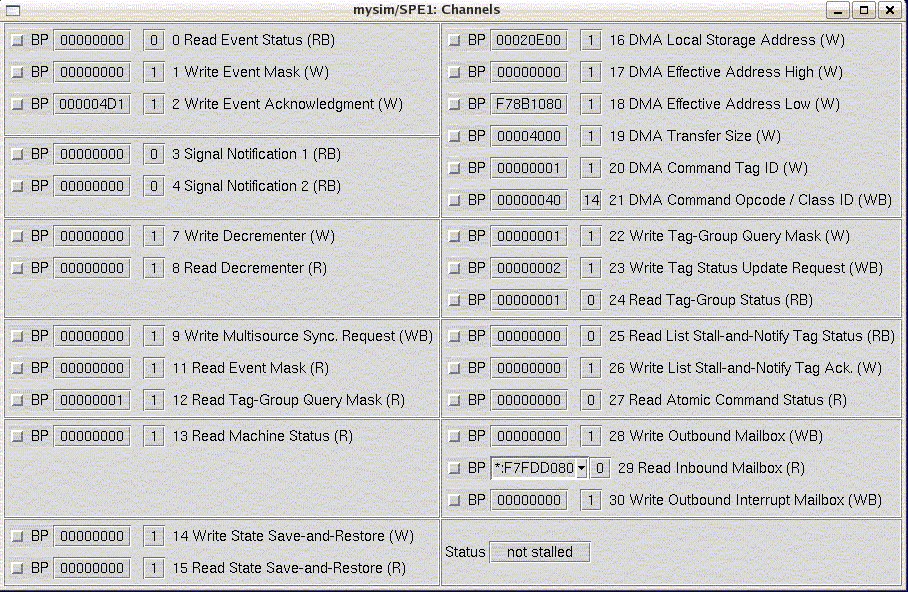
Several interesting SPE data windows are shown in this section's figures. Figure 1 shows the MFC window, which provides internal MFC state information. Figure 2 shows the MFC_XLate window, which provides translation structure state information. Figure 3 shows the SPEChannel window, which provides information about the SPE's channels.
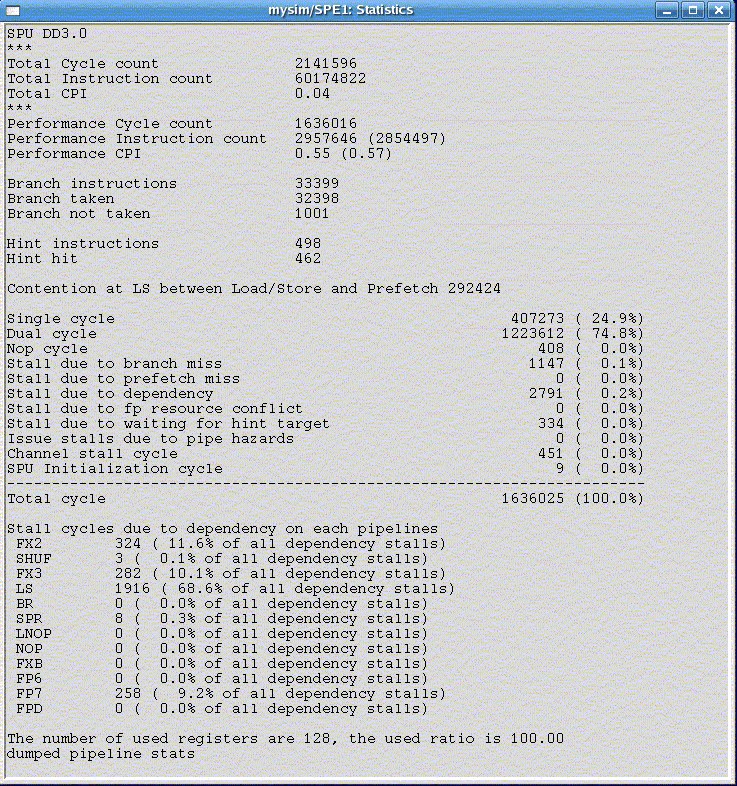
The last three items in an SPE folder represent actions to perform, with respect to the associated SPE. The first of these is SPUStats. When the system is stopped and you double-click on this item, the simulator displays program performance statistics in its own pop-up window.
- Model: instruction,
- Model: pipeline, or
- Model: fast.
- instruction mode for checking and debugging the functionality of a program,
- pipeline mode for collecting performance statistics on the program, or
- fast mode for fast functional simulation only.
The model can be toggled by double-clicking the item. The Perf Models button on the GUI can also be used to display a menu for setting the simulator model modes of all of the SPEs simultaneously.
The last item in the SPE folder, Load-Exec, is used for loading an executable onto an SPE. When you double-click the item, a file-browsing window is displayed, allowing you to find and select the executable file to load.