On the right side of the GUI screen are five rows of buttons. These are used to manipulate the simulation process.
The five rows of buttons, shown in Figure 1, do the following:
- Advance Cycle — Advances the simulation by a set number of cycles. The default value is 1 cycle, but it can be changed by entering an integer value in the textbox above the buttons, or by moving the slider next to the textbox. The drop-down menu at the top of the GUI allows the user to select the time domain for cycle stepping. The time units to use for cycles are expressed in terms of various system components. The simulation must be stopped for this button to work; if the simulation is not stopped, the button is inactive.
- Go — Starts or continues the simulation. In the SDK's simulator, the first time the Go button is clicked it initiates the Linux boot process. (In general, the action of the Go button is determined by the startup tcl file located in the directory from which the simulator is started.)
- Stop — Pauses the simulation.
- Service GDB — Allows the external gdb debugger to attach to the running program. This button is also inactive while the simulation is running.
- Triggers/Breakpoints — Displays a window showing the current triggers and breakpoints.
- Update GUI — Refreshes all of the GUI screens. By default, the GUI screens are updated automatically every four seconds. Click this button to force an update.
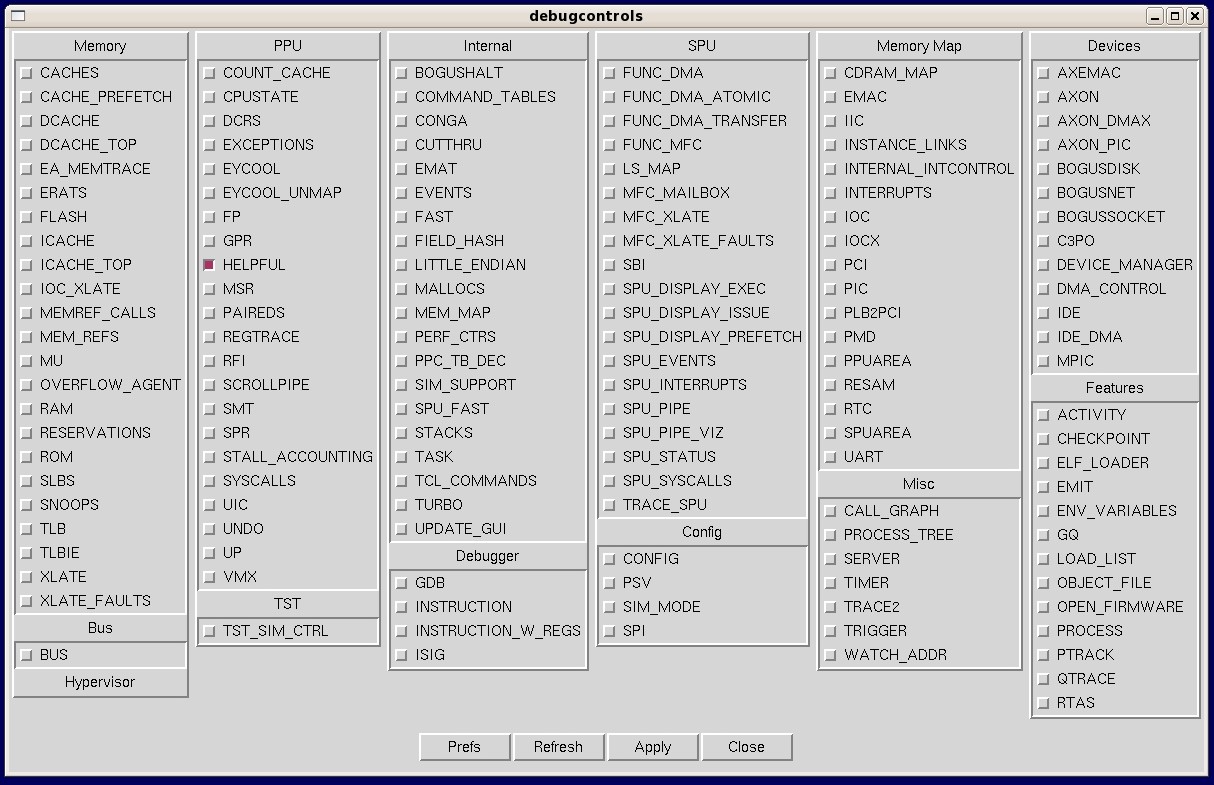
- Debug Controls — Displays a window of the available debug controls and allows you to select which ones should be active. Once enabled, corresponding information messages will be displayed. Figure 1 shows the Debug Controls window.
- Options — Displays a window allowing you to select fonts for the GUI display. On a separate tab, you can enter the gdb debugger port.
- Emitters — Displays a window with the defined emitters, with separate tabs for writers and readers. Figure 1 shows the Emitters window. For more on emitters, see Emitters.
- Fast Mode — Toggles fast mode on and off. Fast mode accelerates the execution of the PPE at the expense of disabling certain system-analysis features. It is useful for quickly advancing the simulation to a point of interest. When fast mode is on, the button appears depressed; otherwise it appears normal. Fast mode can also be enabled with the mysim fast on command and disabled with the mysim fast off command.
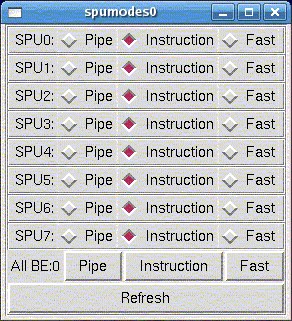
- Perf Models — Displays a window in which various performance models can be selected for the various system simulator components. Provides a convenient means to set each SPU's simulation mode to either cycle accurate pipeline mode or instruction mode or fast functional-only mode. The same capabilities are available using the Model:instruction, Model:pipeline, Model:fast toggle menu sub-item under each SPE in the tree menu at the left of the main control panel. Figure 4 shows the SPU Performance Model Modes window.
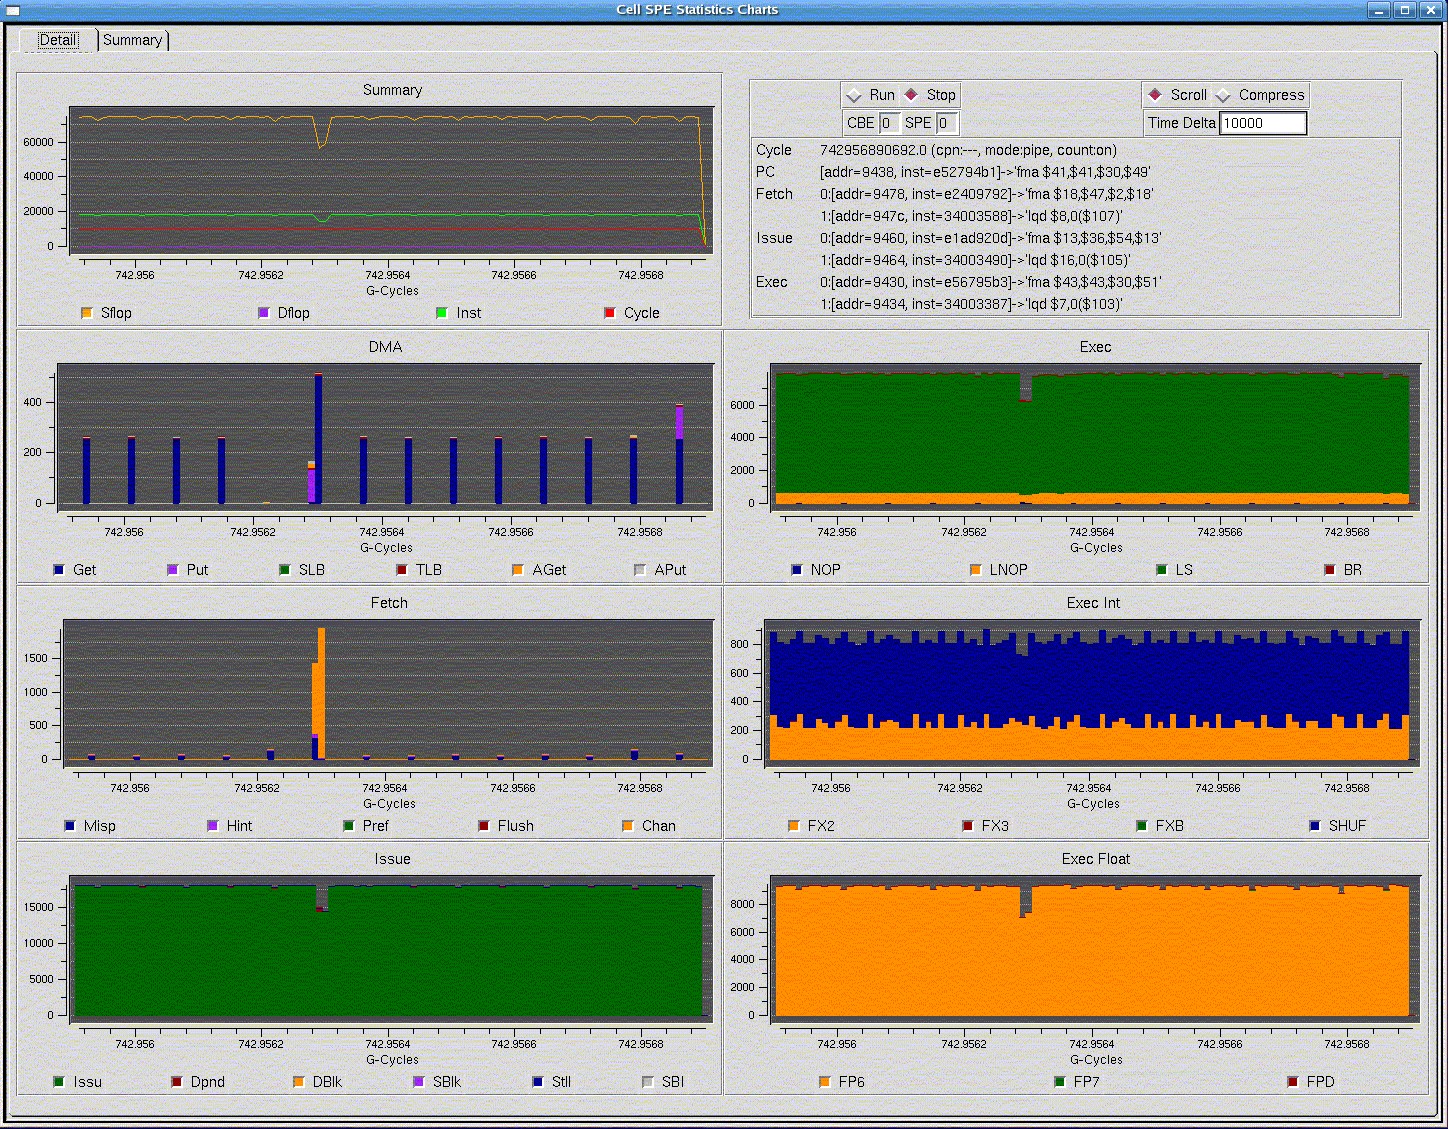
- SPE Visualization — Plots histograms of SPU and DMA event counts.
The counts are sampled at user defined intervals, and are continuously displayed.
Two modes of display are provided: a “scroll” view, which tracks only the
most recent time segment, and a “compress” view, which accumulates samples
to provide an overview of the event counts during the time elapsed. Users
can view collected data in either detail or summary panels.
- The detailed, single-SPE panel tracks SPU pipeline phenomena (such as stalls, instructions executed by type, and issue events), and DMA transaction counts by type (gets, puts, atomics, and so forth).
- The summary panel tracks all eight SPEs for the CBE, with each plot showing a subset of the detailed event count data available.
- Process-Tree and Process-Tree-Stats — This feature requires OS kernel hooks that allow the simulator to display process information. This feature is currently not provided in the SDK kernel.
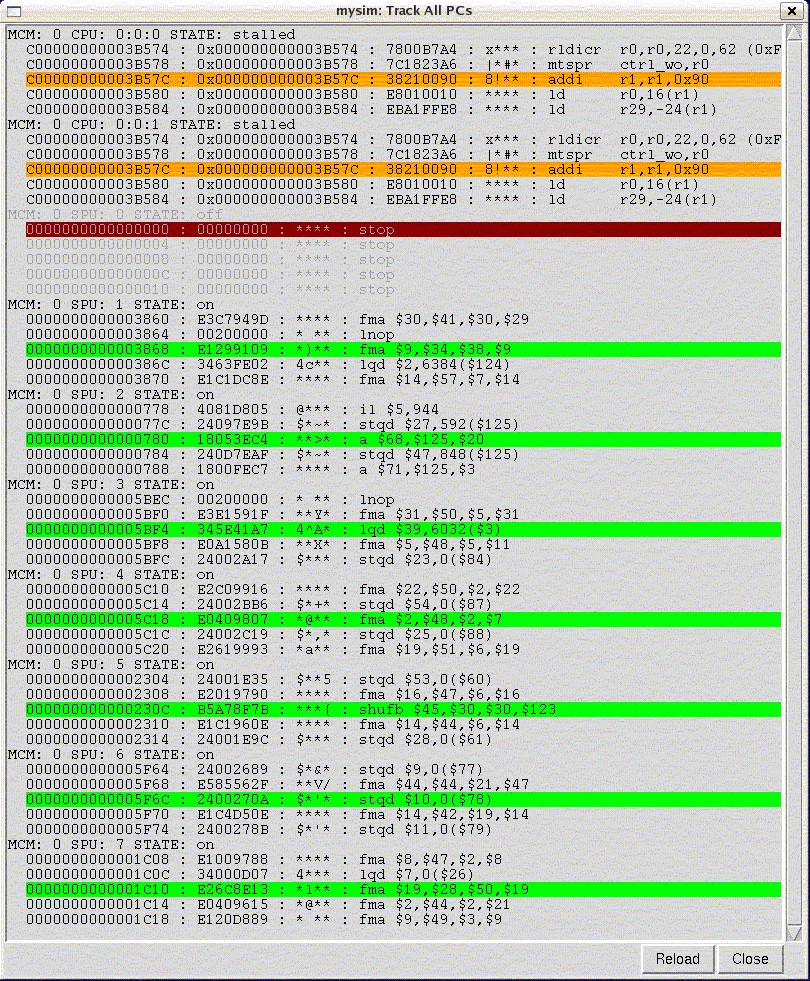
- Track All PCs — Figure 3 shows the Track All PCs window.
- SPU Modes — Provides a convenient means to set each SPU's simulation mode to either cycle accurate pipeline mode or fast functional-only mode. The same capabilities are available using the Model:instruction or Model:pipeline toggle menu sub-item under each SPE in the tree menu at the left of the main control panel. Figure 4 shows the SPU Modes window.
- Event Log — Enables a set of predefined triggers to start collecting the log information. The window provides a set of buttons that can be used to set the marker cycle to a point in the process.
- Exit — Exits the simulator and closes the GUI window.


